Page 1 of 2
Add a (Production - Consumption) Graph
Posted: Fri Jul 07, 2017 10:30 am
by miketwo
I assume this has been suggested before, but I honestly couldn't find it when I searched.
The Production and Consumption graphs are great, but often I'm mentally taking the difference between the two. I would love a 3rd graph that shows the difference, so I can focus on items that are being used more than being produced.
Re: Add a (Production - Consumption) Graph
Posted: Fri Jul 07, 2017 1:13 pm
by Factory Lobster
Difference (or net production) graph in production graph / Combined view production minus consumption
Posted: Sat Mar 10, 2018 4:20 pm
by BenBlut
TL;DR
An extra graph with the netresults (production minus consumption) to see bottlenecks earlier
What ?
Right now there is a nice production and consumption graph. with a nice time-selection and selection of product.
I wouldd like a third column with the difference between production and consumption.
A drawing says more than a thousand words, so here is my photoshop:
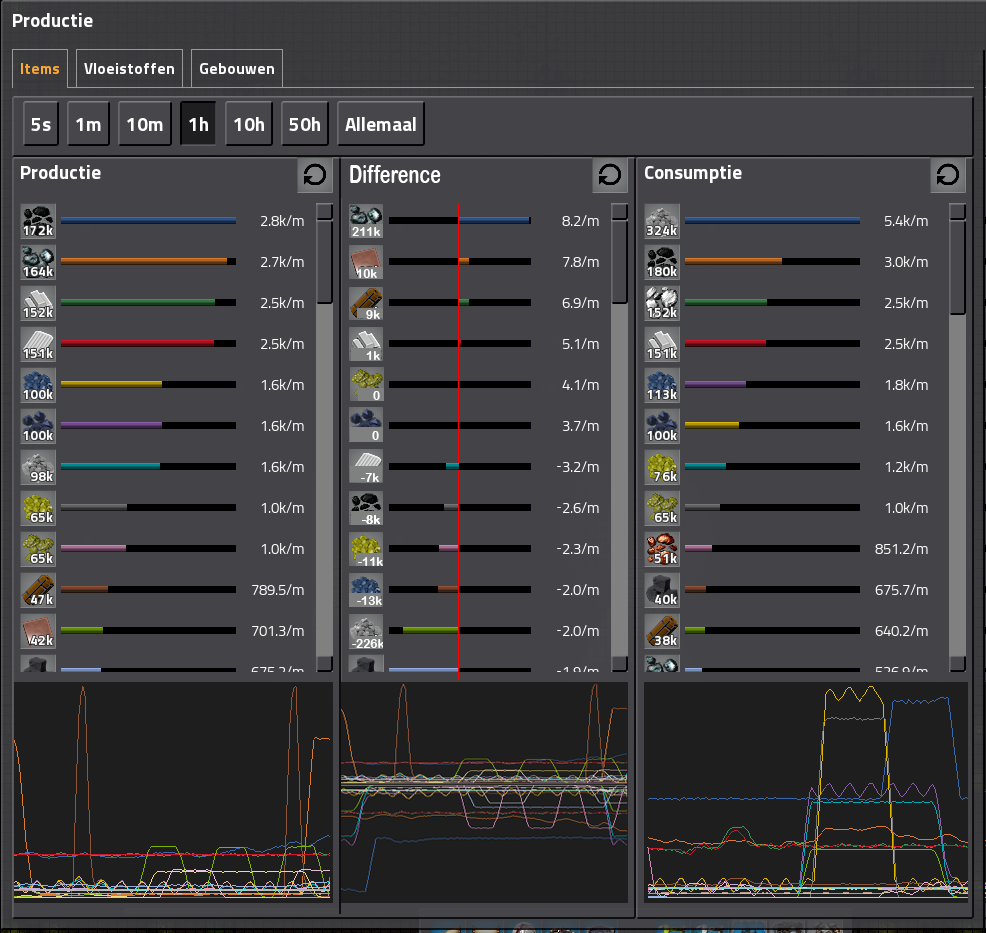
The numbers in the middle column are just made in this example.
Why ?
You may want to see which products you are draining or buffering. For example in the photoshop:
Bobs crushed stone: I'm using 226000/hour more right now than I'm producing, so I'm draining by buffer somewhere.
Iron ore: I'm creating 211000/hour more than I'm consuming, so there is a buffer building up somewhere in the factory.
Ideally only the rockets should by positive and everything else should by 0

Re: Difference (or net production) graph in production grapn
Posted: Sat Mar 10, 2018 5:23 pm
by eradicator
BenBlut wrote:Ideally only the rockets should by positive and everything else should by 0 :)
You're insane. I like insane. So you get:
+1★
Re: Difference (or net production) graph in production grapn
Posted: Sun Mar 11, 2018 8:24 am
by Caine
A very good idea, I would like to see this added.
Re: Difference (or net production) graph in production grapn
Posted: Tue Mar 13, 2018 9:59 am
by EpicPartyGuy
+1!
Add production "difference" automaticly "p" stats
Posted: Fri Mar 30, 2018 5:24 pm
by enderland
Currently, pressing p shows both production and consumption statistics.
I would like to see a third panel of information that is "difference" in order to quickly identify what items a factory may be producing too many of or too few of compared to consumption.
Right now, you can use the production/consumption stats but:
- The pages may be sorted differently
- You still have to do the math in your head
- If you want to see over time, this is difficult
My proposal would be to have the difference calculation automatically be shown as part of the "p" production statistics view.
Re: Add production "difference" automaticly "p" stats
Posted: Wed Apr 04, 2018 1:33 pm
by BenBlut
Just like the my suggestion a few ago:
viewtopic.php?f=6&t=58578
Re: Difference (or net production) graph in production grapn
Posted: Thu Apr 05, 2018 7:07 am
by fiery_salmon
I really like this idea, it would be especially useful worth mods adding many intermediate products.
Is there already some mod doing something like that?
Re: Difference (or net production) graph in production grapn
Posted: Fri Apr 06, 2018 1:38 pm
by bman212121
I definitely like this idea as well. I'm basically already do this in my head all of the time, so I can get an idea of how much production I need. Having it in a graph would make it a lot easier.
The one other thing I'd like to add to the production graphs is that it would be nice if the graphs themselves actually had axis on them. Looking at a 1 hr graph of a squiggly line isn't easy to figure out the true output in numerical form. Either having scaled graphs that show increments of something with lines for both amount and time, or having info pop up when you're hovering over the line. It's really hard to guess that the peak output is currently 350K/hr, then the line dips. Is that dip 250K, 300K? You just have to try to ballpark a guess.
Re: Difference (or net production) graph in production grapn
Posted: Fri Apr 06, 2018 5:03 pm
by flapje
+1
Re: Difference (or net production) graph in production grapn
Posted: Sat Apr 07, 2018 6:13 pm
by HarusKG
+1
Re: Difference (or net production) graph in production grapn
Posted: Sat Apr 07, 2018 6:56 pm
by ickputzdirwech
Definitely a very good suggestion.
Although it would probably only make sense when you've got a factory already running for some time. And it might be a bit confusing with assembling machines, inserters etc. displayed as well. But that is the case already


Re: Difference (or net production) graph in production grapn
Posted: Sat Oct 06, 2018 3:28 pm
by Amarula
Great idea! I would love to see the production statistics report get some love; my priority request list in order (explanations below):
A) Option to sort the report by net production
B) Option to align items in the report (so the row for an item shows production and consumption and net production)
C) Option to hide the graph and only see the numbers, or only see graph and hide numbers
D) Maintain the report state (selection of time period, selection of view (items vs fluids vs buildings), any other options)
E*) Add time to depletion of quantity on hand (QoH), and the option to sort the report by time to depletion
Explanation of benefits and reasoning:
A) Sort by net production: Most of the time when I open the report, I want to see if I am running out of items. Yes the current report allows me to select an item like say plastic and check that it is okay. Two thumbs up to the suggestion to add the net production to the report! It would be even more useful for the report to be able to show me in order which items are being depleted the most. As an added bonus, if the report is sorted by net production, it will automatically provide my second request, to align all the data for one item together in the same row!
B) Align items in the report: Again, I want to compare how much of an item I am producing against how much I am using. Having the production and consumption on somewhat randomly different rows in the report (especially if I have to scroll to find it) makes it harder to find and compare. It would be very useful to have the information on one item collected together in one nicely aligned row. I know I can filter the report to get one item, but if I want to check every single item I am producing to see if I am running out of any of them, the filter doesn't help.
C) Option to hide the production graphs: I personally do not find the graph useful in its current form, so I focus on the item numbers. I don't mind the graph being there, but I don't use it. Having the option to hide it would free up some screen space on my laptop, so less scrolling to find the item I want to check.
D) Maintain the report state: On opening the production statistics screen, the default time period is 5 seconds, so the numbers change every second, so the report jumps around like crazy, so I do not have time to find the item I want let alone read its current value. So I always change the time frame; it would be a nice to have quality of life improvement not to have to change it every single time I open the screen. In addition, if I do find a problem say with production of petroleum gas, I go fix the problem then go back to the report to confirm that I have fixed it enough. Again, it isn't a big deal to flip through setting the time frame and switch from items to fluids, but gosh it would be nice if I didn't have to do that.
E*) I have listed Time to Depletion of Quantity on Hand last only because it means collecting data that currently isn't reported, namely the quantity on hand. Each item currently has a count of what has been produced, and what has been consumed (the basis of the production report). This proposal would add a count of what is currently on hand; very simple, when an item is produced, the QoH is incremented by one; when one is consumed (or destroyed), the QoH is decremented by one.
The production statistics report, in addition to the suggested addition of net production, would add the QoH and a calculation of the estimated time to depletion of the QoH. Very simple formula: Time to Depletion = QoH / net production loss per minute. So for example if I have 40K on hand, and I am losing 5K/minute, I have estimated 8 minutes until I run out. Again, not looking to know where the QoH is, or if it is actually available to be used. It is up to me to know that 10K of my QoH is parked in a chest at a remote base, so I really only have 30K available, so I only have 6 minutes to depletion, but the report gives me the basic information to drive what I do first.
The main benefit comes when I can sort the report by time to depletion. Easiest to explain through an example: say my biggest net production loss is iron ore, at 40k/minute. My QoH is 4M, so time to depletion is 100 minutes, over an hour and a half; yes I will want to fix it, but I have time to make adjustments. If the list is sorted by net production, plastic may be way down the list, with a loss of only 600/minute. However, if my QoH is only 700, I only have 1.1 minutes to get it fixed before I run out!
Thanks again to the devs for all their great work, and to the Factorio community for all these great ideas!
Re: Difference (or net production) graph in production grapn
Posted: Sat Oct 06, 2018 8:09 pm
by flapje
+1
Re: Difference (or net production) graph in production grapn
Posted: Sat Oct 06, 2018 8:58 pm
by WIZ4
Just the right moment to add it. During GUI rewrite
Re: Difference (or net production) graph in production grapn
Posted: Sun Jan 13, 2019 4:07 pm
by Amarula
I just went through the FFF on the updates to the GUI, and I am very much looking forward to it all. However, I didn't see any plans to update the production screen for 0.17, so I am very much hoping it will be looked at in 0.18 "Final GUI improvement. Finishing the rest of the GUIs in the game."
Re: Difference (or net production) graph in production grapn
Posted: Sat Mar 16, 2019 6:12 pm
by BenBlut
Amarula » Sat Oct 06, 2018 4:28 pm
E*) I have listed Time to Depletion of Quantity on Hand last only because it means collecting data that currently isn't reported, namely the quantity on hand. Each item currently has a count of what has been produced, and what has been consumed (the basis of the production report). This proposal would add a count of what is currently on hand; very simple, when an item is produced, the QoH is incremented by one; when one is consumed (or destroyed), the QoH is decremented by one.
This information is already available by selecting the "All"-option as timeselection. It will show the total produced and total consumed, so by subtracting, you get your Quantity on Hand.
(And this was a little bump to get this post on top again, because I still want this option)
Re: Difference (or net production) graph in production grapn
Posted: Sat May 04, 2019 7:36 pm
by Chrisi
+1
Re: Difference (or net production) graph in production grapn
Posted: Mon May 06, 2019 8:49 am
by Qon
BenBlut wrote: ↑Sat Mar 16, 2019 6:12 pm
This information is already available by selecting the "All"-option as timeselection. It will show the total produced and total consumed, so by subtracting, you get your Quantity on Hand.
Yes. It doesn't include destroyed items though so to know the count that would have to be counted as well.